

What is return on ad spend, and why does it matter?
Return on ad spend (ROAS) tells you exactly how much revenue your business earns for every dollar invested in advertising. If you spend $1,000 on a Google Ads campaign and generate $4,000 in sales, your ROAS is 4x. That single number cuts through the noise of vanity metrics and tells you whether your ad budget is actually working.
ROAS sits at the centre of paid media decision-making because it connects spending directly to revenue. Without it, you are flying blind, scaling campaigns that might be quietly draining profit rather than building it. Marketers use ROAS across Google Ads, Meta Ads, TikTok, and every other paid channel to compare performance, justify budgets, and decide where to push harder.
Here is what ROAS does for your business:
- Evaluates campaign performance at the ad, campaign, or channel level
- Guides budget allocation by showing which channels return the most revenue per dollar
- Sets a baseline for scaling decisions, so you know when to increase spend and when to pull back
- Flags underperforming campaigns before they erode your margins
- Supports forecasting by giving you a consistent, comparable metric across periods
How to calculate return on ad spend: formula and worked example
The ROAS formula is straightforward:
ROAS = Revenue attributable to ads ÷ Ad spend

You can express the result as a ratio (4:1), a multiple (4x), or a percentage (400%). All three mean the same thing: four dollars back for every dollar spent. The multiple format tends to be the clearest for benchmarking and day-to-day reporting.
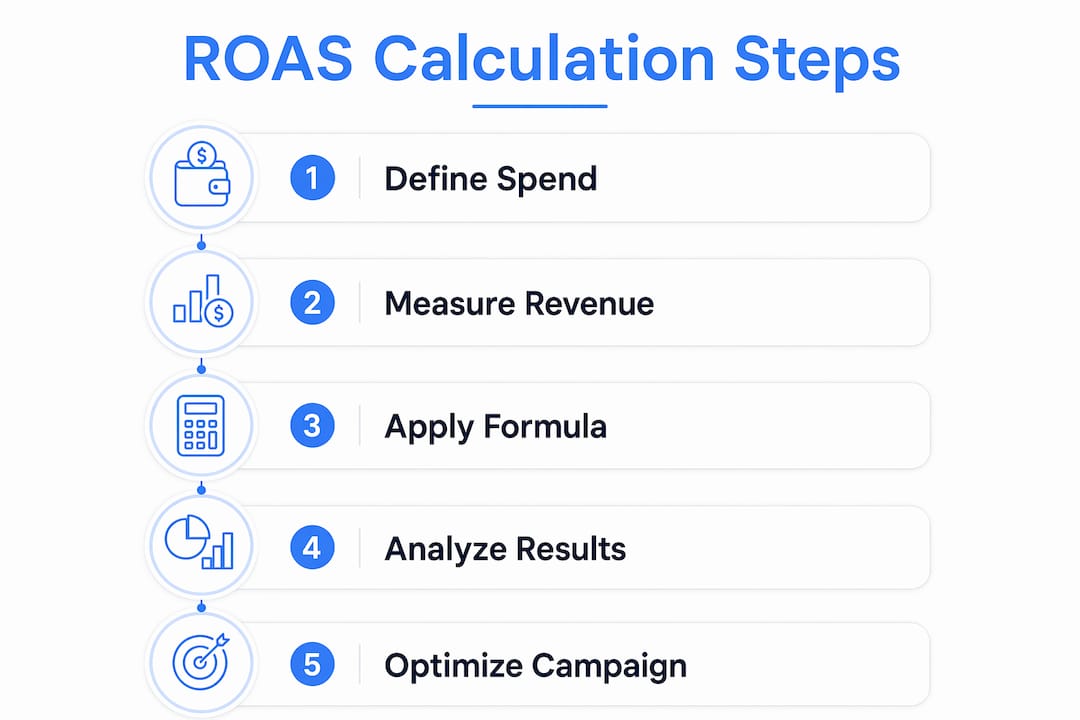
Step-by-step calculation
- Add up all revenue attributable to your ads. Pull this from your ad platform’s conversion tracking or your analytics tool, covering the exact campaign period you are measuring.
- Total your ad spend for the same period, including all platform costs for that campaign.
- Divide revenue by ad spend. That is your ROAS.
- Multiply by 100 if you want to express it as a percentage.
Worked example
Say you run a Meta Ads campaign for a New Zealand e-commerce store over a consistent period with a ROAS of 4x, meaning you earn four dollars back for every dollar spent.
With $500 spent and $2,000 returned, your ROAS is 4x. Now, ad performance metrics like CPC, CPM, CPA, click-through rate, and conversion rate sit alongside ROAS to explain why you got that result. A low conversion rate, for instance, points to a landing page problem rather than an ad problem.
Pro Tip: Always measure ROAS over a consistent timeframe. Comparing a 7-day campaign against a 30-day one produces misleading numbers. Lock in your reporting window before you start, and stick to it.
What is a good ROAS? Benchmarks and break-even explained
A good ROAS is any figure above your break-even point. Everything above that is profit. The question is: where is your break-even?

Break-even ROAS = 1 ÷ gross margin. If your gross margin is 50%, you break even at 2x. Every dollar of ROAS above 2x contributes to profit; every dollar below it is a loss.
Break-even ROAS varies by gross margin, with lower margins requiring higher break-even multiples and higher margins requiring lower ones.
A 4:1 ROAS is a widely cited benchmark, but it is not universal. A business running on 30% margins needs a 3.33x ROAS just to break even, so a 4x result is only modestly profitable. A software company with 70% margins can be profitable at 1.5x. Chasing a 4x target without knowing your own margin profile is one of the most common mistakes in paid media.
The goal is not maximum ROAS. It is maximum profit. Your ideal ROAS is the point where marginal ad spend still returns more than it costs, while generating the highest total profit.
Industry and campaign type also shift what counts as acceptable. Brand awareness campaigns typically run at lower ROAS than direct-response campaigns because their value accrues over time. Seasonal promotions, new product launches, and retargeting campaigns each carry different expectations.
Pro Tip: Set your target ROAS from your own numbers, not industry averages. Calculate your break-even ROAS first, then add your desired profit margin on top. If your break-even is 2x and you want a 30% profit margin on ad spend, your target ROAS is 2.6x.
Common ROAS calculation pitfalls and how to avoid them
Getting the formula right is the easy part. Getting the inputs right is where most businesses trip up.
- Misattributing revenue. Ad platforms often claim credit for sales that would have happened anyway through organic search or direct traffic. Use a consistent attribution model, such as last-click or data-driven, and apply it across all channels so comparisons are fair.
- Ignoring indirect costs. ROAS only counts ad spend in the denominator. If your agency fees, creative production costs, or platform management tools are not included, your ROAS looks better than it actually is.
- Inconsistent tracking periods. Comparing a campaign that ran over a sale period against one that ran in a quiet month produces a distorted picture. Always compare like-for-like windows.
- Mixing campaign types. Blending brand and non-brand campaigns into a single ROAS figure hides what is actually driving performance. Brand campaigns almost always inflate ROAS because users searching your brand name were already likely to convert.
- Poor conversion tracking setup. If your pixel fires on page load rather than on confirmed purchase, or if it double-counts transactions, every ROAS figure in your account is wrong from the start.
Pro Tip: Audit your conversion tracking before you trust any ROAS figure. Check that your analytics and tracking setup records only genuine, unique transactions. A single misconfigured tag can inflate reported revenue by a factor of two or more.
Calculating ROAS at the campaign or channel level, rather than across your entire account, gives you the granularity to act. An account-wide ROAS of 5x might mask one campaign running at 10x and another haemorrhaging money at 1x.
ROAS vs ROI: understanding the difference
ROAS and ROI measure different things, and confusing them leads to bad decisions.
ROAS measures revenue per dollar of ad spend. ROI measures net profit after all costs, including product, fulfilment, salaries, and overhead. A 4x ROAS can actually represent a negative ROI if your product margins are thin and your operational costs are high.
Here is a practical comparison:
- ROAS: Revenue ÷ Ad spend. A channel-level metric. Tells you how efficiently your ads generate revenue.
- ROI: (Net profit ÷ Total investment) × 100. A business-level metric. Tells you whether marketing as a whole is profitable after every cost is accounted for.
- POAS (Profit on Ad Spend): A middle-ground metric that measures gross profit per ad dollar rather than revenue. Useful when margins vary significantly across your product catalogue.
Use ROAS to compare campaigns and channels against each other. Use ROI to evaluate whether your overall marketing investment is building a profitable business. Neither metric alone tells the full story, which is why experienced marketers track both. For deeper campaign-level analysis, marketing analytics platforms can help you monitor ROAS, ROI, and POAS side by side without manual spreadsheet work.
How to use ROAS data to drive better advertising results
Knowing your ROAS is only useful if you act on it. The number itself is a diagnostic tool; the decisions you make from it determine whether your ad spend grows your business or quietly leaks out the back.
- Scale what works. Campaigns running well above your break-even ROAS are candidates for increased budget, provided the incremental spend continues to return above break-even.
- Adjust bids by audience segment. If certain demographics or geographic areas return a higher ROAS, shift bid adjustments to favour them.
- Test creative against ROAS, not just clicks. An ad with a high click-through rate but a low ROAS is attracting the wrong audience. Pause it and test messaging that speaks to buyers, not browsers.
- Analyse by channel. Your Google Ads ROAS and your Meta Ads ROAS will rarely be identical. Treat each channel’s ROAS independently before drawing cross-channel conclusions.
- Balance ROAS with total profit. Maximising ROAS alone can reduce scale and overall profit. Spending $10,000 at 8x ROAS returns $30,000 net profit at a 50% margin, but spending $50,000 at 4x ROAS returns $50,000 net profit. The lower ROAS campaign wins on total profit.
Beyondclix has achieved up to 20x return on ad spend through integrated campaigns that combine paid advertising, SEO, social media, and analytics working together rather than in isolation. That kind of result does not come from optimising a single metric in a single channel; it comes from understanding how every part of the marketing mix affects the final revenue figure.
How customer lifetime value changes the way you read ROAS
ROAS calculated on first-purchase revenue alone can make profitable campaigns look unprofitable, and vice versa. Customer lifetime value (CLV) is the missing variable.
Consider a subscription business where the average customer spends $50 on their first order but $400 over 12 months. A campaign returning a 2x ROAS on first-purchase revenue looks marginal. Factor in CLV, and the same campaign is highly profitable. Using ROAS alongside CLV lets you set a realistic Cost Per Acquisition (CPA) threshold, one that reflects the full value of a customer rather than just the first transaction.
For businesses with strong repeat purchase rates, accepting a lower initial ROAS to acquire more customers is often the right call. The key is knowing your CLV with enough confidence to make that trade-off deliberately. Pair your ROAS data with cohort analysis to track whether customers acquired through paid ads actually return and spend at the rates your CLV model assumes. If they do not, your acceptable ROAS floor needs to come up.
Key takeaways
ROAS is the revenue earned per dollar of ad spend, and your target ROAS should always be set from your own gross margin, not a generic industry benchmark.
| Point | Details |
|---|---|
| ROAS formula | Revenue attributable to ads divided by ad spend, expressed as a multiple, ratio, or percentage. |
| Break-even ROAS | Calculated as 1 divided by gross margin; a 50% margin means you break even at 2x. |
| 4x benchmark | A 4:1 ROAS is a common reference point but only profitable if your margins support it. |
| ROAS vs ROI | ROAS measures revenue per ad dollar; ROI measures net profit after all costs including overheads. |
| CLV integration | Factoring in customer lifetime value lets you set a CPA threshold that reflects the full value of a customer. |
FAQ
What does return on ad spend actually calculate?
ROAS calculates the revenue your business earns for every dollar spent on advertising. The formula is revenue attributable to ads divided by ad spend, expressed as a multiple, ratio, or percentage.
What is a good ROAS in practice?
A good ROAS is any figure above your break-even point, which equals 1 divided by your gross margin. For a business with a 50% gross margin, break-even is 2x; for 30% margins, it is 3.33x.
Is a ROAS of 4 considered good?
A 4x ROAS is a widely cited benchmark, but it is not a universal target. Your own margin profile determines whether 4x represents strong performance or a modest return.
What is the difference between ROAS and ROI?
ROAS measures revenue per dollar of ad spend and is a channel-level metric. ROI measures net profit after all costs, including product, fulfilment, and overhead, making it a business-level profitability measure. A high ROAS can still produce a negative ROI if product margins are thin.
How does customer lifetime value affect ROAS targets?
When customers make repeat purchases, the true value of an acquisition exceeds the first-order revenue. Factoring CLV into your ROAS analysis lets you set a higher acceptable CPA and justify acquiring customers at a lower initial ROAS, provided repeat purchase behaviour holds up in your data.
Recommended
Want this run for your business?
Talk to our team. We will show you where the money is leaking and what we would do about it.